PHP-PlotChart
This class generate chart image with various options defined by associative array (JSON).
Data
Chart drawing settings and plot data are prepared using associative array. Default associative keys are shown bellow.
Chart setting
    // data for chart setting
    $setting = [
        imgw => 600,  // width of image
        imgh => 400,  // height of image
        // margin to plot area
        mgright => 50,
        mgtop => 80,
        mgleft => 80,
        mgbot => 80,
        // text sizes
        tgrid => 15,
        tstitle => 20,
        ttitle => 25,

        psize => 10, // point size
        // number of grid lines
        ngx => 10,
        ngy => 10,
        // color for chart
        text_rgb => '649696',
        title_rgb => '0000FA',
        stitle_rgb => '009696',
        line_rgb => 'E90E5B',
        grid_rgb => '808080',
        axis_rgb => '000000',
        back_rgb => 'FAFAFA',
        chart_rgb => 'EDEDED',

        // String of titles
        strtitle => "This is TITLE",
        strstitle => "Subtitle",
        strstitlex => "Title X",
        strstitley => "Title Y"
    ];
Data to be plotted
    // Data to be ploted
    $data = [
        // drawing options
        pointmode => 0,
        drawline => true,
        drawvert => false,
        drawhorz => false,
        showvalue => false,
        // drawing colors
        line_color => 'E90E5B',
        hline_color => 'E90E5B',
        vline_color => 'E90E5B',
        value_color => '649696',
        // data to be ploted
        u => [
            [-100, -45000],
            [0, 60000],
            [200, 360000],
            [400, -260000],
            [480, 80000]
        ]
    ];
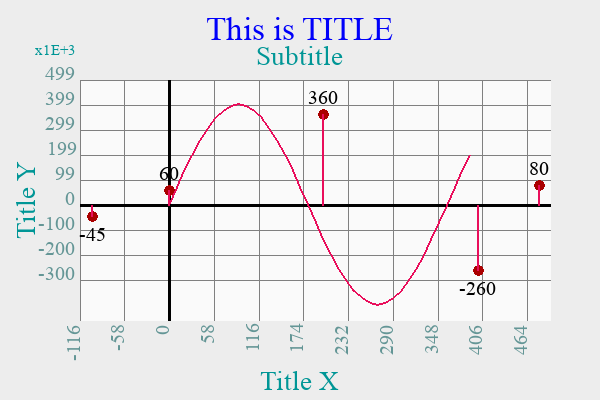
Data example
Example 1
    // example 1 Basic data for minimum requirement
    $data = [
        u => [
            [-100, -45000],
            [0, 60000],
            [200, 360000],
            [400, -260000],
            [480, 80000]
        ]
    ];
Example 2
    // example 2 Data with some options
    $data = [
        showvalue => true,
        pointmode => 1,
        drawvert => true,
        drawline => false,
        color => 'AA0000',
        value_color => '000000',
        u => [
            [-100, -45000],
            [0, 60000],
            [200, 360000],
            [400, -260000],
            [480, 80000]
        ]
    ];
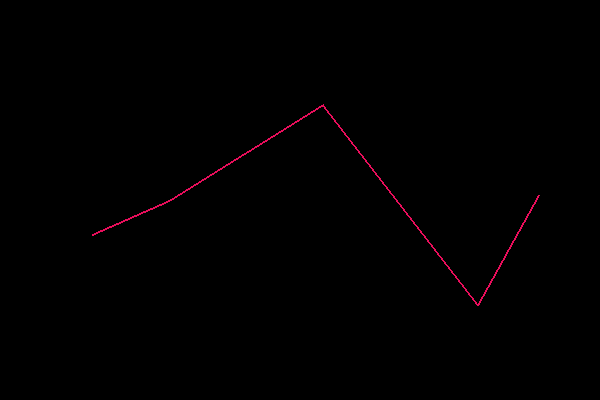
Example 3
    // example 3 Data to change chart settings
    $setting = [
        "strtitle" => "Title is updated",
        strstitle => "Subtitle",
        ngy => 7,
        ngx => 10
    ];
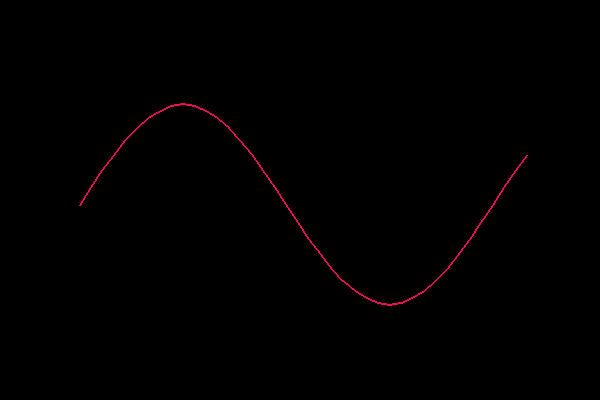
Example 4 Example for sine function
    // example 4
    $f = [];
    for ($i = 0;$i < 40;$i++)
    {
        $A = 10;
        $B = 400000;
        $f[u][$i][0] = $A*$i;
        $f[u][$i][1] = $B sin($A$i * 3.1415 / 180.0);
    }
Usage of PlotChart
Usage 1
    // usage 1
    // add + example 1
    $plotchart = new PlotChart();
    $plotchart->fitGraph($data);
    $plotchart->plotGraph($data);
    $plotchart->viewImage();
Usage 2
    // usage 2
    // add + example 4
    $plotchart = new PlotChart();
    $plotchart->fitGraph($f);
    $plotchart->plotGraph($f);
    $plotchart->viewImage();
Usage 3
    // usage 3
    // add + example 1 + example 3
    $plotchart = new PlotChart($setting);
    $plotchart->fitGraph($data);
    $plotchart->drawGrid();
    $plotchart->plotGraph($data);
    $plotchart->viewImage();
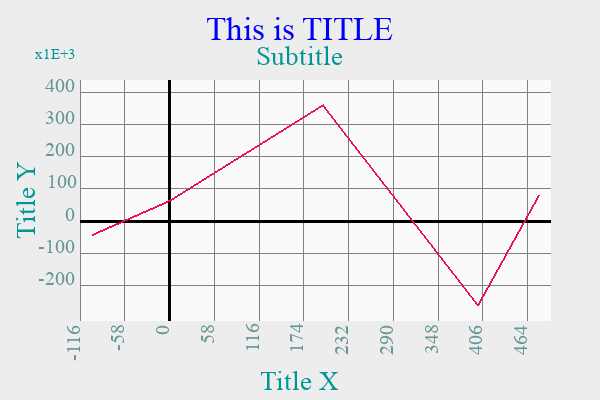
Usage 4
    // usage 4
    // add + example 2 + example 3 + example 4
    $plotchart = new PlotChart($setting);
    $plotchart->fitGraph($data);
    $plotchart->fitGraph($f);
    $plotchart->drawGrid();
    $plotchart->plotGraph($data);
    $plotchart->plotGraph($f);
    $plotchart->viewImage();
Contact
Contact me for comercial use via mail [email protected].


